A while ago, I decided I wanted to keep better track of what books I read. So, I created a low-maintenance google spreadsheet form to help me. I suppose I could have gone with a text file or rolled my own webapp to facilitate this, but a spreadsheet form seemed like the best balance of ease-of-data-entry, available-anywhere, and don’t-have-to-write-any-code.
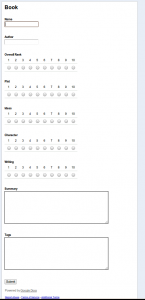
This turned out to be a good choice — I didn’t realize at the time, but Google Spreadsheets has some simple but useful visualization tools. Looking back at my results, some surprising patterns emerged. Y’see, in addition to just tracking standard metadata (author/title/summary), I also ranked the books in a few different dimensions.
[Aside: I’ve been using this stat tracker for fiction books, mostly. My reading habits are different with nonfiction, technical books, and poetry — Nonfiction and technical stuff (machine learning, mostly) I’ll read 5 or 6 and once, skipping around. Maybe this is the influence of the web on my information-foraging. Poetry is even more sporadic, picking up a book when the mood strikes (I’d really like to be more methodical about poetry, but it always seems to be a mood thing). ]
Some analysis…
First, here’s a plot of how many books I’ve entered data for per date. You can see I was pretty good about entering data promptly in 2009, while in 2010 I got a bit lazy and didn’t enter data until I had multiple books to add at once. I wish there was a more automatic way to track this data and enter it automatically, especially now that I’m using an ebook reader (Sony Ereader).
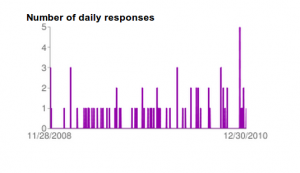
My books-read-per-year is interesting, as well:
2008 [2 months]: 3 (scale this up to 18)
2009: 28 books
2010: 42 books
I hadn’t made a conscious decision to read more books this last year. If I were to hazard a guess at this stat, it’d be that in 2009 I read primarily paper books and 2010 I used an ereader (it certainly is a lot more convenient, both in terms of carrying books around and also selection/ease of procurement of books).
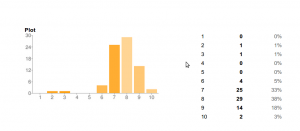
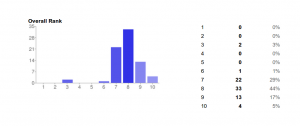
So, now the main plots: I’m very surprised at the distributions! Such nice curves! I would have never thought myself so… normal.
Note there is serious selection bias in the books I read. I’m not going to start reading a book I’m not interested. All these graphs have a right-shifted mean that reflects this.
The metrics I’m ranking over reflect the fact that I’m tracking fiction:
- Character (how well are characters portrayed? Are they flat like Asimov’s worst, or round?)
- Ideas (how interesting/novel are the ideas? Most science fiction I read for the ideas, so this is an important metric for me)
- Plot (awkward? good?)
- Overall
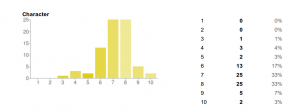
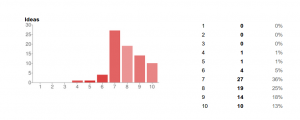
I wish desktop software or web software offered me a way to track this data online, ideally in a social fashion. Goodreads has ranking, but nothing multifaceted like this. Which is a shame, because sometimes I want to immerse myself into a fully-formed world, sometimes I want to soak in ideas.
.
2 Comments
Based on your graphs, looks like you need to adjust your curve =P
But I do like that you rank different facets of books you read. Do you then add them together and give each book an overall score to see which book was better than others?
No, “overall” was just one other metric that I ranked over. Sometimes books can be horrible in all measurable dimensions yet inexplicably awesome. And sometimes (Stephenson’s Quicksilver, for instance) it’s the inverse =).